Featured Free Software

Showing posts with label weather. Show all posts

Monday, July 09, 2007

Free On-line Weather Services updated!


Probably like many of you, I like negative vorticity advection, or "NVA" for short. When a ridge of high-pressure builds in over your area bringing sunny/breezy pleasant days after an especially nasty front passes by, chances are you can find a blob of NVA somewhere in your vicinity at around the 500MB level (about 18,000 ft in the mid-latitudes). Well, on a weather chart I mean... Negative vorticity at 500mb, a measure of negative or anti-cyclonic spin, is a good indicator of downward vertical motion in the mid-levels of the atmosphere, which will often translate into fair skies and pleasant days for awhile. PVA (Positive Vorticity Advection) is NVA's nasty older brother, who loves to bring the pain--cyclonic-turning, upward-lifting, scary organized bad-weather patterns with maybe a nice pre-frontal squall line of severe thunderstorms thrown in for good measure. Run for the storm cellar!


One of my blog categories is "Weather Related", which hasn't been getting much attention lately, due to my darn gadgets and my laziness, but it's high-time to update the darn thing, so that's what I did. Luckily for you, you don't need to locate the NVA, or PVA to use these awesome/free on-line services, but if you want to try, here's a link to the NWS NGM model forecast upper-air charts. Tell ya what...You locate the PVA areas correctly in this 500MB vorticity chart (not much strong, organized PVA/NVA this time of year in the N. Hemisphere), and I'll... I'll declare you an honorary SP & PPC magazine forecaster geek extraordinare, or something. Or, maybe, I'll just give you some more cool weather links to check out instead...


=> Read more!


Thursday, August 31, 2006

Ernesto coming...Watch from your PPC

Ben Stanley (check out Ben's blog), one of our superb expert bloggers at SP and PPC Magazine blogs recently reviewed this tracking tool called Hurricane Tracker from Survivorsoft for monitoring Tropical Storms and such (as one was heading right for him), and being the weather geek that I am, couldn't help giving a shout out...Go check it out here

Monday, July 24, 2006

Forecast the Weather with Your Handheld Part2


This is a continuation of a several part article on using your handheld for forecasting the weather. See the original post here to get the links and previous background information...


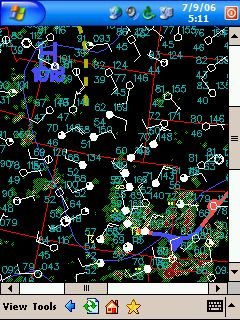
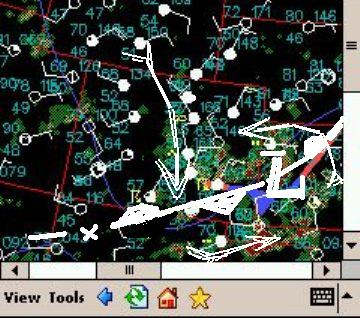
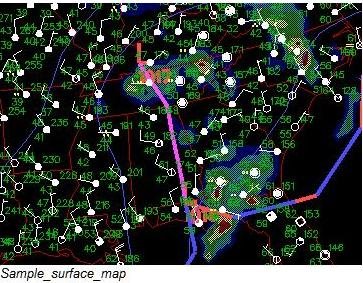
The same principles apply for the surface analysis as in the previously discussed upper-air products, except the pressure values are typically reported in millibars or inches of mercury (MB, or Hg), and are corrected to mean sea-level pressure (or MSLP) so that surface stations at different locations can be standardized. This is the typical values regurgitated in TV, and local media reports. Remember that all definitions and measures for wind, temperature, pressure and humidity can be easily looked up on wikipedia.com or similar online resource. Let’s look again at a surface (SFC for short) analysis and the keys for that level as well:


Surface charts and upper air charts look a little different in a chart package and rightly so. We have so far focused on the 500mb level in the upper levels, but it’s very important for the weather professional to take note of the patterns revealed for all the significant levels, because each might indicate slightly different clues to the dynamics that are occurring in the atmosphere over a region, and taken together reveal an approximate 3-D representation. After a full analysis of all the significant levels in a surface and upper-air package, the forecaster will begin to understand the current state of the structure over the region.

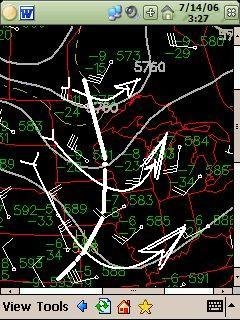
500MB Example with my edits to indicate a Trof, and the upper level flow pattern


The following are basic features to look for on the charts in a classic mid-latitude migratory weather pattern (loosely defined as one where the polar front jet is steering the migratory systems through your area):

Tight Cyclonic Wind Turning: At all levels in the northern hemispheric troposphere, counter-clockwise turning (especially sharp turning or deflection over a short distance) is an easy way to spot organized low pressure weather systems in the atmosphere. In strong cyclones or organized low pressure areas, this will be pronounced up through the 300mb layer. These systems typically stack well through the layers at all levels over a region and will be evident on each chart, tending to stack vertically back towards the colder air behind a surface cold front and just behind the surface low. See previous chart..

Anti-Cyclonic Wind Turning: High pressure, while somewhat more diffuse in organization is similarly located by looking for an organized clockwise turning in the winds, usually following somewhere behind the previously mentioned cyclonic area…Basically the inverse of the flow pattern you see above…

SFC analysis with my edits (re-analysis of the fronts, Low, and wind pattern)


Low and High pressure centers, ridges, or troughs: Usually indicated by a cluster of strongly curved isobars or isoheights (which are what we call the lines on the map). Think of a vortex in the wind patterns mentioned previously. Winds typically point out of a high and in toward a low, and so it translates that a closed off circle of low pressure would be a center of rotation and represent the lowest pressure or least dense air in the vortical column rising up from surface, a high would characterize the opposite. At the SFC, highs typically follow a cold front, the front being basically a trough of low pressure formed out ahead of the super dense cold air behind the front. The frontal systems will usually be rotating around a closed-off low somewhere out ahead of the following high pressure. A warm front will usually be found out ahead of a low also rotating around the center (slower than the cold front, which is how an occluded front forms). These frontal systems not only rotate around the low center, but they also translate in horizontal distance in relation to the movement of it. In the upper levels, a closed off pressure center may or may not be evident, but a trough or ridge most likely is evident following just behind the surface feature.


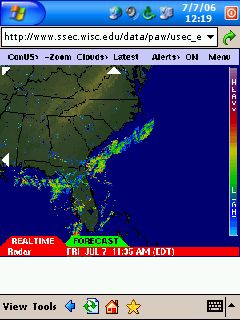
Areas of High Humidity, weather, radar echos: Some charts show you lines of equal RH (the percentage of moisture content based on Temp/Dpt ratio), some dew-point and some indicate dew-point depression (DPD, which is simply the value of the temperature and dew point spread). Low-level charts at 700mb (10000ft) and below indicating moisture content in the air mass in question are among the most useful in determining the overall weather effects produced by a system. For instance a cold/dry trough of low pressure may pass through your area with little weather effect other than some windy surface conditions, but moves downstream and is able to draw substantial amounts of moisture from a large body of water, and turns into a blizzard for the next locale. Strong cyclones will have a consistently high moisture content throughout the stack. Many surface analysis products will be an amalgam of plots with actual weather, and radar data indicated as shown above. Satellite pictures are also a very important tool for noting the moisture distribution over a region.

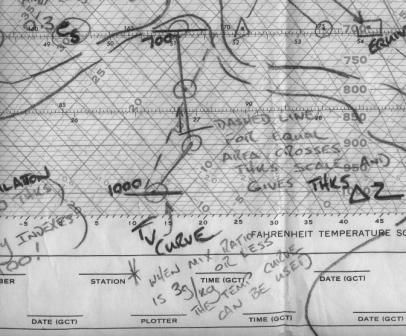
Hot and Cold pockets: Represented in isotherms. The temperature profile can be the most problematic element for determining an accurate forecast, and is best if considered in relation to the actual moisture content. Temperature can vary or change rapidly in an airmass, and is probably the single most important factor in determining the outcome of a given scenario, as it is often the single modifier for all other parameters. A strong, cold airmass that starts out over Canada moving south is already warming up from below and being modified and therefore it’s other native properties (pressure, and humidity) will also change. As with the previously mentioned dry cold front scenario, an airmass temperature can change considerably when passing over a large moisture source. A common practice is to use the upper levels and surface charts in similar practice as with the pressure analysis to search for pockets or centers of cold or hot air (or in their absence a cold trough or warm ridge), but for the consideration of temperature advection (horizontal movement of a colder or warmer air mass), it is often better to use an indicator called Thickness. Thickness is a representation of virtual temperature of a layer of air (say from 1000mb-700mb) over a region. It is essentially the temperature at which a dry air parcel equals a moist parcel at the same pressure…Now look what you did! Caused me to lapse into weather-speak! Oh the horror!. Ok, let me try a formula:

Tv=T + w/6 where Tv is virtual temperature, T is Temperature, w=mixing ratio in g/kg, divided by 6

I told you this weather stuff was easy…

The thickness is not as hard as it sounds. Think of it this way, you want to divide up the atmospheric temperature profile between the surface and 700mb level considering an average temperature for the layer. Add to that the mean actual moisture content (which is basically what mixing ratio is) for the averaged temperature layer. Using the skew-t diagram we can take that value, and apply it to an empirical scale for that layer (1000-700) which gives us our thickness calculation. Still not clear, huh? See an example below, and note the intersecting line drawn across an equal area of the temperature profile:


Don’t freak out over thickness, as we’ll apply how to use it when we get to using the model forecast products.

Now, we finally get to the vertical sounding plots, which come in some different flavors as well. See a screenshot below for a preview of the next installment:


Friday, July 07, 2006

Forecast the Weather with Your Handheld Part 1


Back in the day, before I was a computer geek, I was a weather geek in the military, and since I have surrounded myself with gadgets, thought I might do a comprehensive write-up on tools and services available on-line for the would-be gadget freak/weather buff, and also provide an overview of weather forcasting technique in general.


My intention is to write this review entirely on my handheld and post it on my blog at various stages. We will see how long that will last... I'm already cussing at the thing, but the tengo keyboard is doing it's best. Eventually, I will migrate it to my official Smartphone and Pocket PC magazine blog when it's a bit more complete. Some useful links to the various services that will be mentioned in this article, and will be added to I'm sure as this review progresses:

1. PDA Animated Weather (Mobile)
2. Weather Underground (Mobile)
3. Bev Howard's Pocket Radar (Mobile)
4. NOAA weather products (Mobile)
5. Unisys Weather
6. NCEP NGM Models-(replace "12" with "00" in URL for the 00Z run)
7. Yahoo (Mobile)
8. Google (Mobile)

Please add your comments or suggestions to this, as it's a work in progress. All scrrenshots will be added eventually. Click on the image or comments to read...

My PPC magazine blog

Background:
Weather is probably the only universal ice-breaker known to man. When people can't think of what to say in a conversation, they invariably talk about the weather. It's even become controversial. Try talking about global warming in a group, for instance, and see if a debate doesn't erupt. Who'd a thunk it? Boring old weather up there with topics like religion, and capital punishment. The point being that weather information is important, and the day might come when you need your weather, er I mean, global warming update like yesterday, and you can't get the Weather Channel (what if the aliens causing global warming decide to block it). What do you do? Navigate to this review of mobile weather products, of course, and don't leave your basement whatever you do.

Who are you, you might ask, to tell me where to get my weather products? Answer, just another geek with too much time on his hands. Even worse, one with a bunch of useless information rolling around in his head, and who has his own blog. Back in the day, I was a weather forecaster in the Air Force, and besides hiding alien bodies from the press, I had the privilege of learning how to analyze the atmosphere in 3 dimensions, and on paper no less.


Weather Charts:
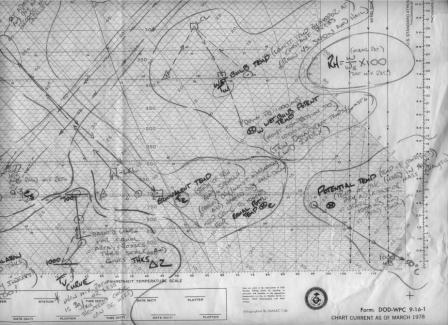
Yep, that spaghetti you see really means something. It's a skew-t diagram used to characterise the atmosphere over your weather station. Back in the stone age before computer chart analysis came along, charts were hand analysed and hung on the wall. My scrawlings there are cheat-sheet notes so I could remember how to compute my weather stability indexes. What are indexes you ask? They are often important indicators that a monster tornado might tear through your house that very afternoon, sucking you into outer space with the aliens. Scared? You should be. Those aliens have teeth. I saw em when we dumped the bodies. Well, before you go haring off in search of diagrams on-line to do your own analysis, some background first.


Weather charts, both on your computer and in the flesh, come in basically 2 flavors: Horizontal representations and vertical representations (see above). True you can get fancy 3-D, rotateable, computer animations of the atmosphere, but that stuff is mostly for the egg-head types doing research. Rank and file forecasters usually don't have time for that. They deal mainly in the here and now, and what that means for the next 48 hour forecast period. Beyond that, the available products start to get flakey. So, creating a forecast usually starts with analysing the vertical and horizontal atmospheric state around the area within say the last 12-24 hours. The best way to do that is with a good synoptic-scale analysis of the current surface and upper-air weather products. What's all that stuff mean, you ask? Ok, this is going to take a little longer than I thought...

Horizontal Charts:
Let's start with horizontal chart analysis. You ever seen a contour map? If you go out into the wilderness, you might want to get a current one if you aren't familiar with the surrounding terrain. Did I mention I was attached to the army for awhile? It's true, although I don't like to talk about it. Embarrassing for an honest zoomie to admit he was relegated to the army. Anyway, it was the best thing that could have happened to me, because I learned a lot of valuable stuff, like how to read a contour map. Basically, it overlays lines of equal elevation on your map, so that you can figure out where you are in relation to the terrain features. Once you understand the basic premise, hills and valleys pop right out of the map at you. See a gray-scale relief map of the Sierra-Nevada mountains below as an example (which is of course nicely shaded, but you get the point)...


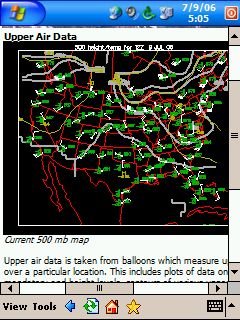
It's not quite that simple, and you need a compass of course, but with practice and experience you can become quite proficient at navigation without a GPS. Where were we? Oh, yeah, weather charts. Think of surface and upper-air horizontal charts as contour maps for the atmosphere. Instead of terrain making the hills and valleys, the air mass itself makes them. How can this be, you ask? Well, the atmosphere piles up hills and valleys of dense and less dense air, just like the earth does so with rock and soil. Here's a horizontal map depicting the atmosphere at around 18,000 feet over the US on the the 9th of July:


The little concentric lines you see on a weather map terminating with a tight circle and an H or an L planted in the center are hills or valleys of high and low air pressure. Think of the high air pressure as a ridge or mountain, and the lower air pressure areas as the trough of valley. The air pressure value for a particular spot on the map is averaged from the weather stations in the area sending in reports, and is determined at each station by weighing the column of air above that point with a very sensitive instrument called a barometer. The pressure is measured periodically and reported back to a central computer at some giant weather center like the National Weather Service. The central computer uses this data along with other reported data like winds, temperature, and humidity to generate most of the weather maps currently available. The spaghetti lines on the map encircle areas of lesser or greater values of pressure, temperature, humidity and the like. So, your call up your favorite forecast model (more on models and map levels later), and you see a big blob of high relative humidity (RH) on the 700mb map, and it's heading your way, you might want to think about taking in the wash.

Sounds kind of big brother-ish, eh? Think of Skynet in the Terminator movies. Some big super-computer brain with a hoard of interconnected systems digesting mountains of data constantly, and using sophisticated programming routines to spit out products that tell you your wedding day will be ruined. Actually that's not so far from the truth as you might think. The interconnected systems include satellites in space, automated laser sensors, doppler radar, and yes even killer robots. Okay, the killer robots are only a precaution against the public becoming aware of the super-computers (The robots were still de-activated when I was in the service, at any rate).

Seriously the other stuff I mentioned is true. The modern day weather station is a very sophisticated operation compared to the vintage 1950s tech we had in my day (I'm not that old, but the AF was in serious need of upgrades even in the 80s and 90s). Luckily, we still have humans running the show, but not as many as we once did, and now that you have a basic understanding of how horizontal analysis comes about, let's dig into a little more detail. I'll try not to tee off the computer programmers in this next section too much.

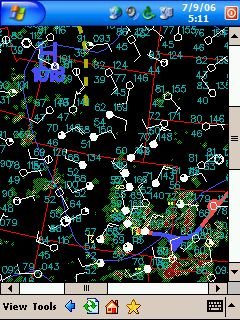
The atmosphere should be thought of in layers. For the exercise of describing it on paper or computer, this must be done. Theoretically you could divide it up into nano-layers on the scale of literally millions of little slices, but this would be exercise in futility, and would choke the super-computers into frozen apoplexy, not to mention make the collection and reporting process something that would require hiring every living being on the planet to support. So, we chunk the layers into ranges, say from the surface to like 5000 feet, and then from 5000-10000, and so on. We'll start with the surface. See a current analysis product typical for the surface below:


Surface Reporting:
Surface weather phenomenon is observed and reported at well..the surface of the earth, as described previously, at weather stations all around the globe faithfully every hour (and sometimes more frequent when massive weather changes occur). This weather observation data is compiled in a weather report that inculdes the pressure, temp, and humidty (dew point actually), and other important weather phenomenon like sky condition (cloud heights, types and amount), visibility (how far you can see), thunder, lightning, rain and other weather stuff to include UFOs. You put the UFOs in the remarks section along with a direction and distance from the station and of course movement, so the fighter jets can pointlessly scramble out to eat their UFO dust. At Christmas you would sometimes see some clever oberserver had added a remark in his obs that said something like, "FAT MAN IN SLEIGH OVR CMU MOVG ENE", which was such a riot. He was probably put on report when someone went back and did QC on his obs for that shift. See example below:

METAR Formatted Surface Weather Observation
000
saus41 klwx 071456
mtrnak
metar knak 071454z auto 03006kt 10sm clr 22/13 a3026 rmk ao2 slp248
t02220133 51007 tsno

Vertical Chart Analysis:
At some weather stations they have a special group of weather dudes called rawinsonde operators that are primarily concerned with the air above the surface . They could care less about hoot about the surface, because their job is to send up weather balloons with little electronic emitters attached to them. As the balloons rise up through the atmosphere they send back little weather reports to the operators with stuff like pressure, winds, temperature, and humidity (actually dew point depression) at each of those important layers we talked about (say 5000, 10000, 18000, 30000, and 40000 feet). Actually they send back more than that, but for general synoptic-scale horizontal analysis, we only care about those levels, meaning for grasping the general weather pattern over the eastern US, we look at only those levels. See an example of the data below

usus41 klwx 071200
maniad
72403 ttaa 57121 72403 99014 14208 00000 00208 17856 35011
92873 14657 03515 85582 09256 00513 70166 04269 35512 50582
14370 28508 40747 26770 24029 30949 37771 22068 25072 46569
22076 20218 51767 22053 15402 55365 21530 10658 61163 24007
88164 56365 24032 88103 62563 23511 77239 22577 40820 31313
58708 81102 51515 10164 00007 10194 02013 00512=

Vertical Weather continued...

Wait a minute... You were talking about horizontal weather and next thing I know you switched up all of a sudden. What’s all this 500 millibar and 700 millibar crap anyway (500mb, 700 mb)? What’s wrong with you, you might ask? Are you all there? No, and sorry about jumping around, but remember how I described how they get surface weather reports out to the public, to the computer, and ultimately to the maps. Now I need to explain how they create the upper-air horizontal products, the data for which starts out as vertical data like shown above. Remember how we talked about the important levels in the atmosphere, and the little balloon transmitter that sends back information on them? The reporting stations all around the world that have rawinsonde equipment send that data back to the central computer just like a surface report, but only every 12 hours or so when they launch a weather balloon (the aliens don't want any more cases of mistaken identity like at Roswell). The computer crunches away and creates a horizontal map for each of the those important levels from the vertical sounding data. For weather calculation purposes, the layers are referred to in terms of pressure levels instead of altitudes.

We look at the 500 millibar chart (18,000 feet) when we want to see what’s going on at about the midway point in the troposphere--which is where all the weather stuff most humans care about occurs, the Troposphere is usually within the lower 30,000 feet in the mid-lattitudes, but it varies based on geographic location, season, etc. A thorough analysis of surface and upper air data for areas of organized low pressure, especially along a frontal zone (or trough at the upper levels) represents a good chunk of synoptic-scale meterology and forecasting. Basically, forecasting in a nutshell (in the northern hemisphere from say September to June), is mainly looking for these semi-organized blobs of lower pressure coming at you at the surface, and at the 500mb, how far they travel in a given time period, when you expect them to affect you, and how much the effect will be. Sounds easy doesn’t it? It isn’t, but you have to walk before you crawl, right? There are many flavors of weather forecasting disciplines/related fields of study (tropical meterorology, convective scale dynamics and severe weather forecasting, upper-atmospheric stuff, radar and satellite techniques, and on and on). You have only begun your training, my young Jedi. Next we learn about temperature, winds, and dew-point. Don't worry, we will eventually get to actual vertical charts, but not yet...not yet!

500MB Analysis (GPH, TMP, DPT, WND)
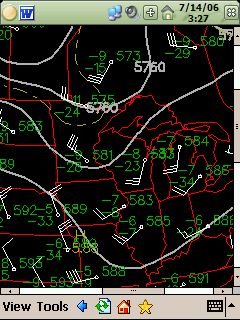
Ok, so you know a bit about horizontal/vertical chart analysis now, eh? Let's look at some actual charts, and try and apply these basic skills shall we? First, we'll check out a current 500mb chart from the Unisys weather link posted at the start of this tome:


What's all that spaghetti? Those are lines of equal Geo-Potential-Height (GPH), and temperature of course. Duh!... The little circles with funny symbols sticking out are station plots from the vertical sounding data over the central US. They indicate the wind direction and speed, the height, temperature, and dew point for that station for the latest balloon run. Wait, you were going to explain all that stuff to us, you said? Geo-potential what? Bueller? Anyone?

This one is a bit confusing, I admit. GPH is a way to describe horizontal pressure above the surface across different regions and elevations. As you go up, obviously there is naturally less air above you, and therefore weighs less, so instead of using a standard pressure reading like at the surface (millibars) to indicate a value for your station, the balloon reports back the height at which it reached the constant pressure surface instead (GPH). This allows us to reveal the real differences in air pressure aloft over a given region. For example, take the Des Moines, Iowa report indicated on the map above. It reports a GPH of 583, which is shortened and really means 5830 meters, by the way. Assuming a constant pressure surface existed at roughly 500mb, or at around 18000 ft over the US, the actual height of it over Des Moines at the time of this sounding would be 5830 meters. In contrast, the pressure over Omaha, Nebraska is 589 or 5890 meters (60 meters higher), which indicates that the 500mb pressure surface is a little higher over Omaha. Basically, all this mumbo-jumbo means that at roughly 18,000 feet, an area of higher pressure exists over the Omaha region than over Des Moines.

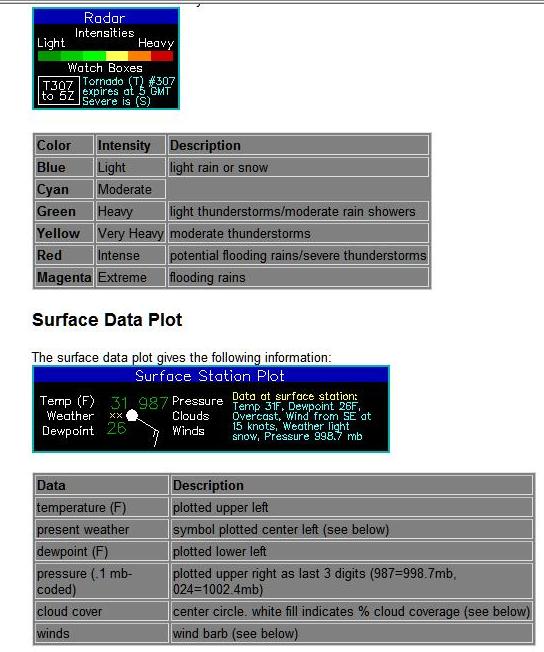
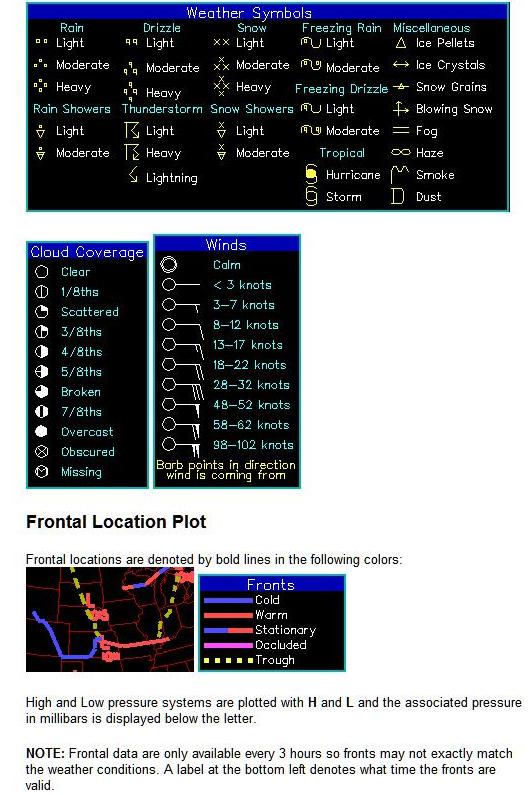
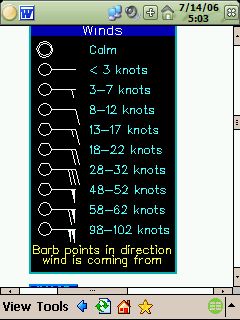
Right, well you probably know what temperature is, but if not, you can look it up on wikipedia.com. The long and short of it is this... It's a measure of what's hot and what isn't. Dew point is the value you must cool the temperature to in order for dew to form. It is a good basic indicator of the amount of humidity in the atmosphere. Think of it this way, the greater the spread between temp and dpt, the drier the air. The closer the 2 are and the more humidity there is. More humidity means more chance of clouds, rain, snow, etc. How about that weird wind symbol? It's actually called a windbarb, and the stem part tells us the direction the wind is coming from, and the pips or lines hanging off of it indicate the speed in roughly 5-10 knot increments. A flag indicates about 50 knots. Here are some plot keys from the Unisys Weather site:


Stay tuned for more on the codes, the charts and mobile weather forecasting in the next installment...